Blog
Science in the Raw
15 June 2015
Yesterday’s post on the sound of the big bang generated quite a bit of discussion about the cosmic microwave background (CMB), how it’s measured, and what it tells us. One of the challenges in interpreting the CMB data is that it’s very heavily processed. Some skeptics argue it’s too processed, so today I thought I’d talk about how we go from raw data to a detailed study of the early moments of the universe.
 Brooks/Cole
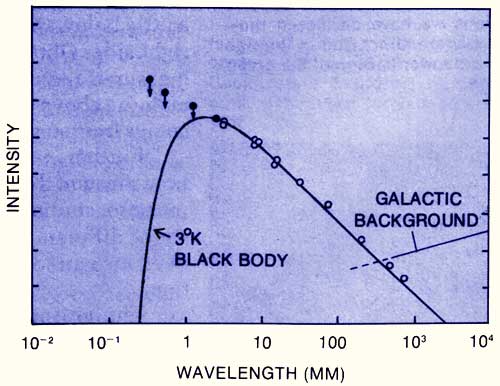
When Penzias and Wilson discovered the CMB in 1965, they didn’t create an image map. What they did was to show that in all directions of the sky there is a uniform microwave background of a particular intensity. This intensity was in agreement with the prediction of a uniform thermal background due to the big bang. Over the next couple of decades, both ground based observations and observations made from high altitude balloons found that the cosmic background did indeed seem to follow the intensity curve of a thermal blackbody with a temperature of about 3 K. Since our atmosphere absorbs quite a bit of the shorter wavelengths of the blackbody curve, it was hard to pin down the temperature too precisely. To do that we needed to go beyond the atmosphere.
 COBE
COBEA big breakthrough came in 1989 with the Cosmic Background Explorer (COBE). This was a space-based observer that made a high-resolution survey of the sky. As expected, COBE observed a very uniform thermal background with a temperature of 2.728 K. The observations matched a blackbody curve more precisely than any experiment done thus far. If you plot the results as a temperature projection, what you get is a uniform temperature across the entire sky give or take a few thousandths of a Kelvin. We finally had definitive proof of the big bang. But COBE was designed not only to measure the overall temperature of the sky, but also to measure small variations in temperature at different points in the sky. From this we could determine not only the existence of the big bang but some of its details.
If you subtract out the average temperature from the CMB data, what you’re left with are variations on the order of milliKelvin. One of the first things we notice is that about half the sky is a bit warmer than the average, and about half is a bit cooler. You can see this in the projection maps of the relative temperatures across the sky. The yin-yang shape seen in the map is a dipole distribution, and it’s due to the motion of the Earth relative to the cosmic background. If the Earth is moving toward an object, the light we observe is shifted slightly toward the blue end of the spectrum (shorter wavelengths). For the CMB this means it looks a bit warmer than it actually is, since warmer objects emit shorter wavelengths. Likewise, if the Earth is moving away from an object, its light is shifted toward the red (longer wavelengths) and as a result the CMB looks a bit cooler in that direction. This shift of wavelengths due to relative motion is known as the Doppler effect, and is a basic tool of modern astronomy. From this dipole moment we find that galaxy is moving about 360 km/s relative to the cosmic background, which is actually faster than we expected.
 Planck
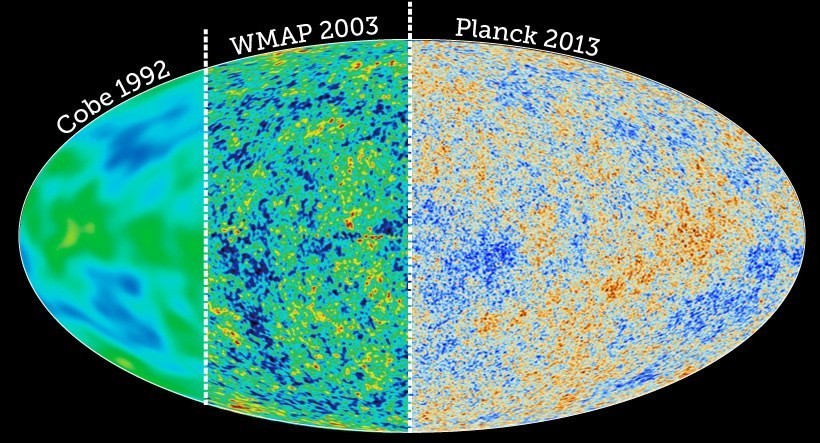
If you subtract the dipole moment from the data, then you can see fluctuations on the order of microKelvin. This is where the real meat of the CMB data is. Unfortunately at this level the interference from the Milky Way is a major source of the fluctuations. You can see it as a warm band across the center of the map. This is because we are within the Milky Way, and our view of the deep sky is somewhat obscured. To overcome this problem we have to distinguish between light coming from things like galaxies (called the foreground) and light actually coming from the cosmic background. To do this we observe the sky at several wavelength ranges. Foreground objects have a different spectral distribution than the cosmic background, so by observing the sky at several ranges we can make accurate maps of the foreground in order to subtract it from the data. The COBE satellite mapped the sky at three different ranges. WMAP made five maps in 2003, and Planck made nine sky maps in 2013. With more and more detailed foreground maps, we can more accurately subtract the “noise” from the real data.
 Wayne Hu
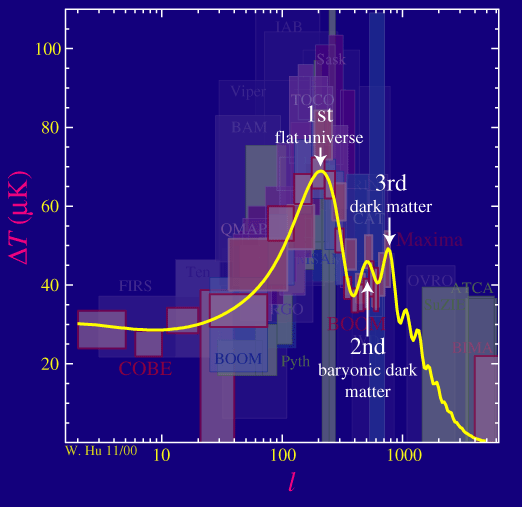
With an accurate map of the fluctuations in the CMB we can then study the scales at which fluctuations occur. In mathematical terms we expand the ripples into a sum of multipole moments, of which the dipole is only the first. Basically just take the total average temperature of the whole sky, then split the sky into two regions and take an average of each section, then split and average again, and so on. Keep doing that, and you get an “average” temperature at each scale. From this we can create a power spectrum showing the strength of fluctuations at each scale. Within this power spectrum there are several peaks. The first three peaks of the spectrum tell us about the structure and history of the cosmos. The first peak tells us how flat the universe is (perfectly flat to the limit of observation). The second tells us the amount of regular matter in the universe (about 4.9% of the total mass-energy) and the third tells us the amount of dark matter (about 26.8% of the mass-energy). From the CMB we have moved beyond simply proving the big bang, and are now studying the details of cosmology. We have other sources of data beyond the CMB, and they generally agree with the results of the cosmic background.
At higher and higher multipoles (or smaller fluctuations) the foreground becomes increasingly difficult to remove. Gas and dust throughout the universe becomes a significant problem. This is part of the reason why it’s been so difficult to find evidence of cosmic inflation and why the results of BICEP2 were so controversial. It remains to be seen whether we can pull ever more signal out of the noise, and whether that will be enough to answer some of the basic questions of the origin of the universe. But even if we fail, we’ve come an astonishingly long way toward understanding our universe.