Blog
Carbon Chain
27 October 2014
 Tomassetti, Matteo, et al
One of the common ways we can map the distribution of matter in a galaxy is by observing the light emitted by neutral hydrogen. This works pretty well because hydrogen is the most abundant element in the universe, and its emission lines are pretty distinctive. But for distant galaxies hydrogen emissions aren’t very bright. To observe them you need really long exposure times, and that limits the amount of galaxies you can observe. One alternative is to look at the emissions of carbon instead.
Carbon isn’t nearly as common as hydrogen, but its emission lines are brighter, particularly for distant galaxies where redshift is a factor. By mapping the distribution of carbon we can get an idea of the distribution of hydrogen. Of course this relies upon certain assumptions. For example, it’s generally thought that carbon and hydrogen are evenly mixed in a galaxy, so if you find lots of carbon there should also be lots of hydrogen.
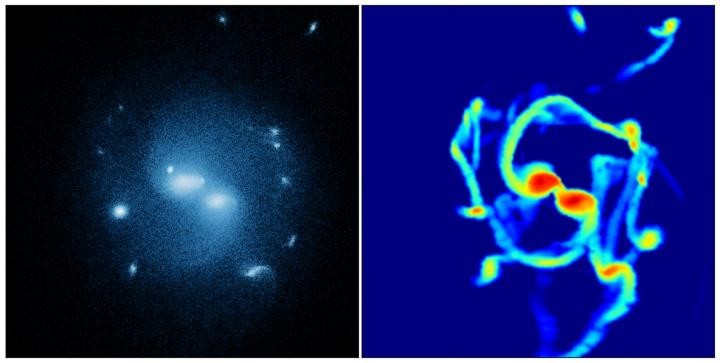
Now a new paper introduces a method that greatly increases the precision of this method.1 The method uses computational simulations of galaxies and compares them to the distribution of carbon. In the the paper, the authors use a simulated observation of carbon emissions from the ALMA radio telescope array, and then ran hydrodynamic simulations to determine the distribution of hydrogen. They found that 80% of hydrogen in a galaxy could be mapped through carbon observations with significantly shorter exposure times.
The paper demonstrates that by combining observations and simulations we can probe young galaxies in more detail. This is particularly useful in studying galactic evolution. Now we’ll have to see how it works in the real world.
Tomassetti, Matteo, et al. “Atomic carbon as a powerful tracer of molecular gas in the high-redshift Universe: perspectives for ALMA.” Monthly Notices of the Royal Astronomical Society: Letters 445.1 (2014): L124-L128. ↩︎