Blog
Three Peaks at
the Big Bang
3 September 2014
 NASA/JPL-Caltech/ESA
One of the big points of evidence in support of the big bang is the cosmic microwave background (CMB). It is often described as the afterglow of the primordial fireball, but it is much more than that. As we make better observations of the CMB we not only gather evidence of the origin of the universe, we also get an indication of the specific nature of our universe. One of the ways we see this is through what’s known as the three peaks.
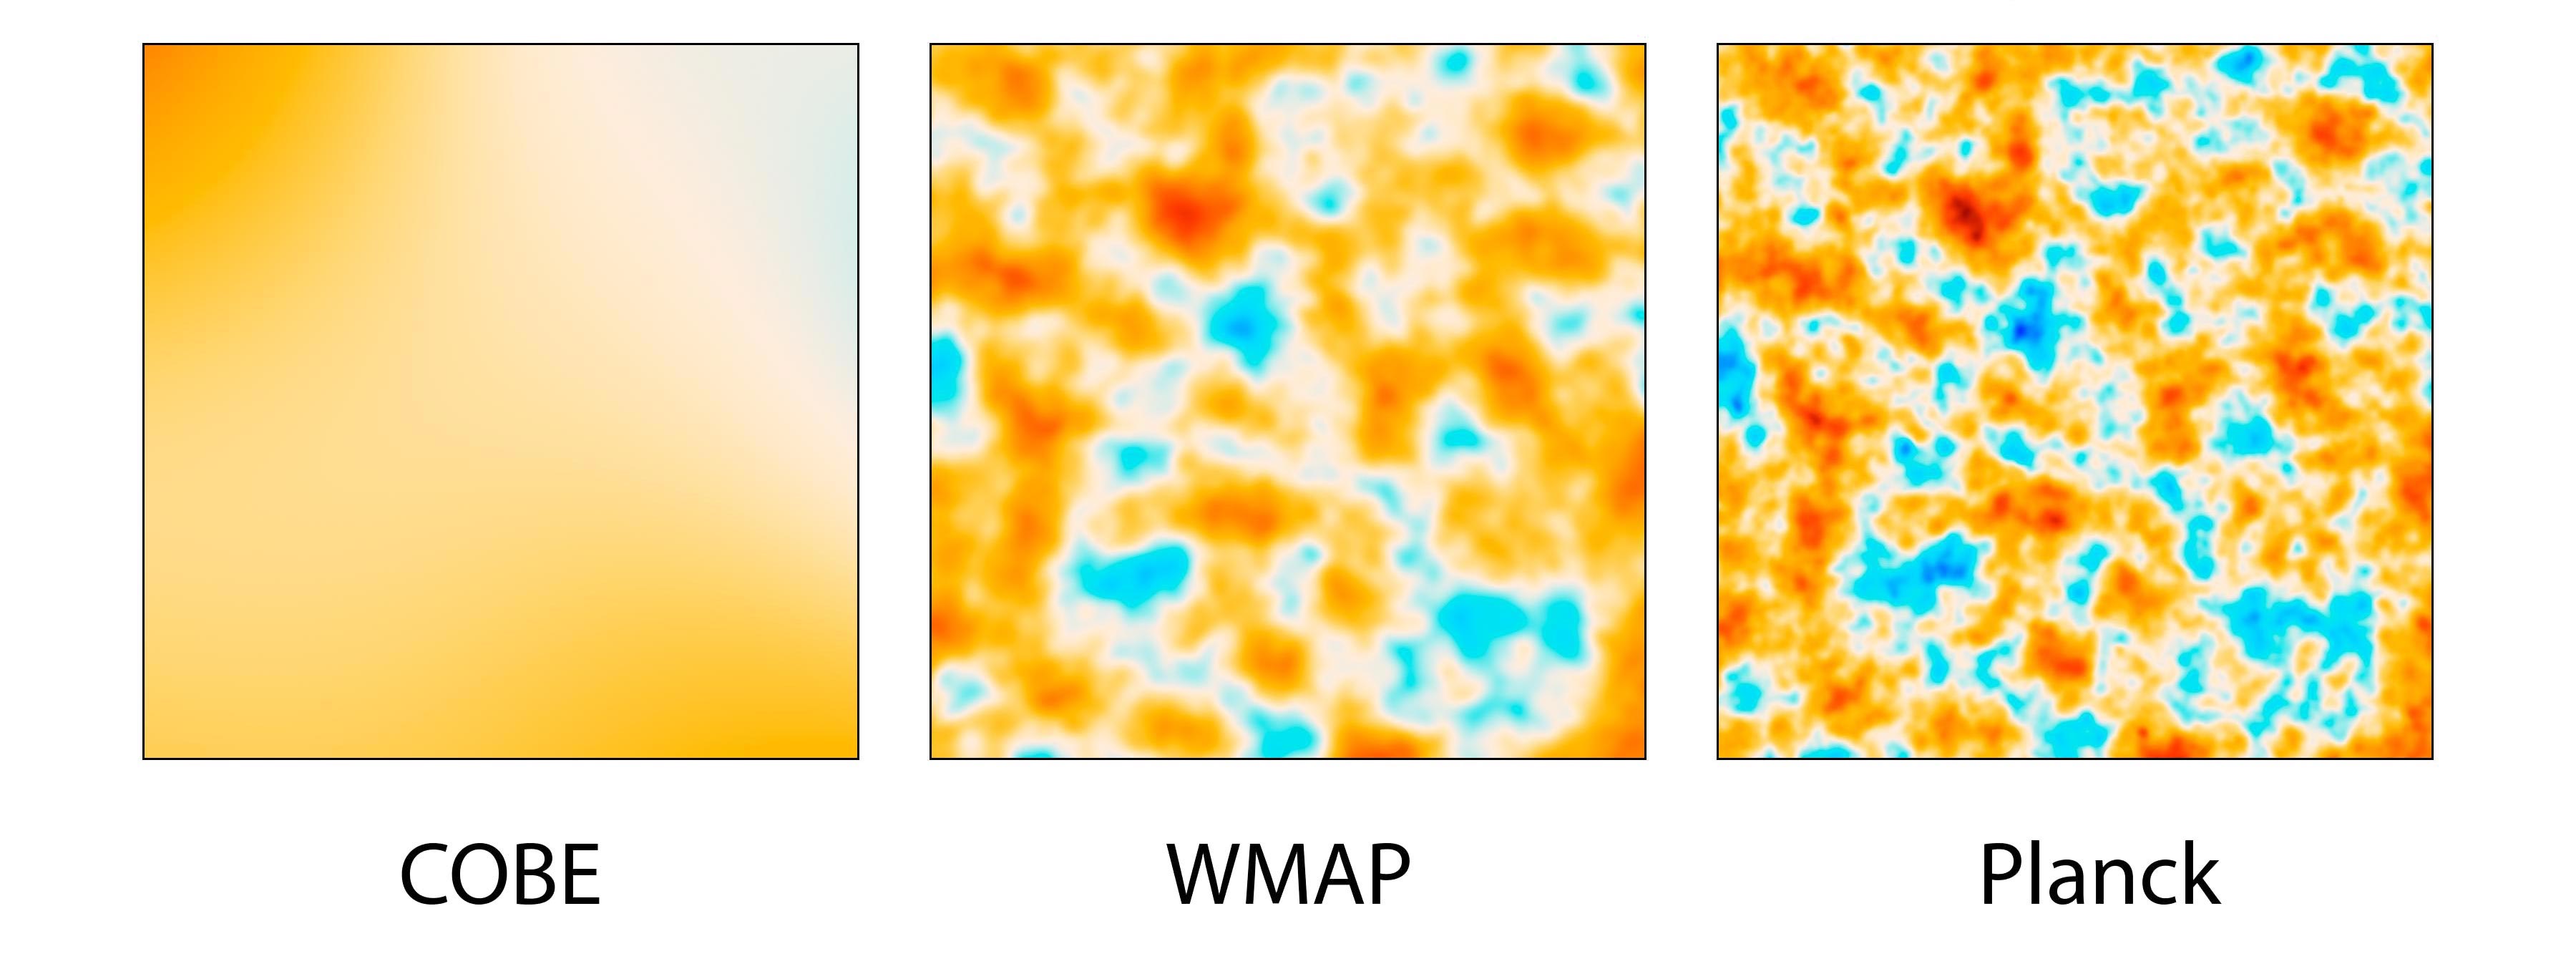
When we look at the cosmic microwave background, one of its distinctive features is that it is a thermal blackbody. In all different directions, it has a temperature of 2.7 K. This is exactly what you’d expect if the universe was once in a hot, dense state. While the CMB is extraordinarily uniform in temperature, it isn’t perfectly uniform. There are very small fluctuations in temperature. These fluctuations were mapped in detail by the COBE satellite in 1992. Later, more detailed maps of these fluctuations were made by the WMAP and Planck satellites.
 Wayne Hu
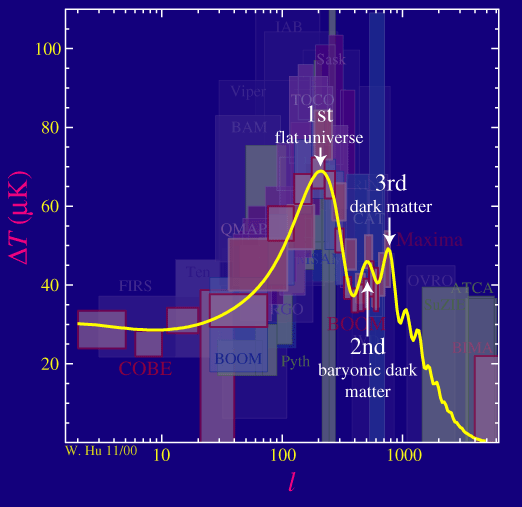
These variations in temperature are like ripples on the cosmic pond. By observing these ripples we can determine what was happening in the universe when it was very young, which in turn tells us things about the universe today. One of the ways we do this is by looking at the scales at which temperature fluctuations occur. You can see this in the figure, where the amount of temperature fluctuations (in microkelvin) is plotted against what is known as the multipole moment (l), which is a measure of the fluctuation scale. Basically, you just take the total average temperature of the whole sky, then split the sky into two regions and take an average of each section, then split and average again, and so on. Keep doing that, and you get an “average” temperature at each higher multipole scale. When this power spectrum of CMB fluctuations is plotted, you notice a big first peak, followed by two smaller peaks before it dies off in a series of small fluctuations. It is these three peaks that paint a clear picture of our universe.
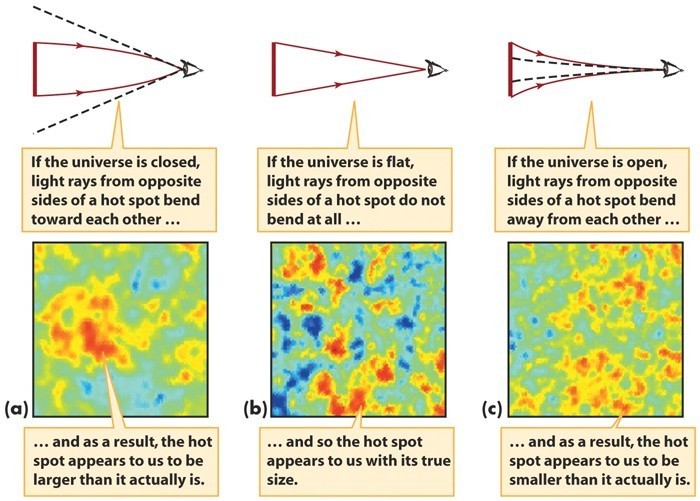
The first peak is an indication of how flat or curved the universe is as a whole. Since the cosmic microwave background comes from the farthest edge of the visible universe, it’s light can be distorted by the cosmic curvature. If the universe is flat (like a flat sheet of paper) then the fluctuations we observe would appear undistorted. If it is positively curved (like the surface of the Earth) then the fluctuations would appear magnified by the cosmic curvature. If the universe is negatively curved (like the surface of a saddle) then the fluctuations would appear smaller.
On the power spectrum curve, this means the first peak would be more to the left if the universe is positively curved and more to the right if negatively curved. What we find is that the first peak is at about l = 200, which the value for a flat universe. Within the limits of our CMB observations, the universe is exactly flat. This means that the universe as a whole is at least 150 times larger than the observable universe. It may be infinite, but at the very least it is really, really big.
The second peak tells us about the amount of matter in the universe. Given the initial fluctuations in the universe, all matter would tend to gravitationally clump toward the higher temperature (higher density) fluctuations, which would tend to reinforce them on smaller scales. But regular matter (the kind that interacts with light) would also tend to heat up as it clumps, and the resulting pressure would tend to push against the clumping matter. So the more regular matter you have, the more pushback you would get. This means that the more regular matter there is in the universe, the more the second peak will be damped. So the smaller the second peak, the more matter in the universe. Given the observed level, we find that regular matter makes up about 4.9% of the mass/energy of the universe.
The third peak is an indicator of dark matter in the universe. Dark matter gravitationally clumps like regular matter, but since it doesn’t interact strongly with light, it isn’t affected by the pressure of light against it. So as the regular matter clumping experiences a push-back, the dark matter clumping does not. So the height of the third peak gives us a measure of how much dark matter there is compared to the total amount of light in the early universe (what’s known as the matter/radiation ratio). Since we know that light and regular matter are related, the matter/radiation ratio tells us the amount of dark matter in the universe. From this we find that dark matter makes up about 26.8% of the mass/energy of the universe.
 ESA/Planck
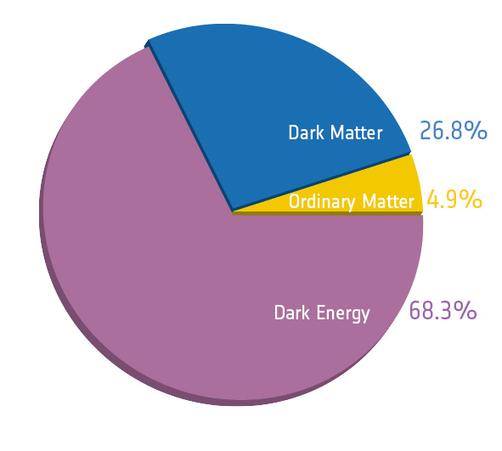
Since the universe is flat despite having matter and dark matter, the remaining mass energy must be in the form of dark energy. Without it, the universe would appear positively curved (closed), which we don’t see. So from observations of the CMB we find the universe is flat, about 4.9% regular matter, 26.8% dark matter, and 68.3% dark energy. This is found simply from the cosmic microwave background. We have other observations, such as the redshift/distance relation of galaxies, the way in which galaxies clump in the present universe, and a variety of other tests. They all give similar results. In this way we have a confluence of evidence that clearly shows the size, age, and structure of the universe.
But even if all we had was the cosmic microwave background, we would still know quite a bit. And as we gather even more sensitive observations, it will surely tell us even more.