Blog
A Man for All Seasons
15 July 2017
 Donald R Miller Photography
Welcome to the last part of our series on The Heartland Institute’s report on global warming.1 You should read the first three parts if you haven’t already (Part 1, Part 2, Part 3). In this series I’ve focused a lot on how the NIPCC report frames the issue. They use emotional hooks to sway readers, focus on opinions rather than data, and use vague references to make it difficult to verify their claims. This was done intentionally to get people to feel that global warming is false without looking at the evidence. It is propaganda, not science. Now, it may be that global warming is false, but it’s clear The Heartland Institute isn’t interested in proving it. They just want you to believe it’s false. But if you’ve made it this far in the series, I assume you’d like to look at the actual science. What does fair and honest research say about climate change?
There’s just one catch. I’m not a climate scientist. So in the large scale of things I’m not qualified to assess all the nitty gritty details of climate research. There are lots of folks that can, but I’m not that guy. I can’t tell you whether global warming is real (though I do think it is). But I am an astrophysicist. I’ve even written a book on computational astrophysics. So what I do know pretty well is astrophysics and how to do scientific research. With that in mind, I want to look at one particular claim made by the report. It’s the section called “Modern Warming Is Not Unnatural” on pages 76-78.
The section opens by claiming the IPCC assumes rising temperatures could not be due to natural causes, calling it a “false postulate.” Once again the authors have framed the issue. The IPCC assumes their conclusion, rather than being open to natural causes. So if the Heartland Institute Report can show warming has natural causes, you can dismiss the IPCC’s claim. The report then states:
Even assuming, wrongly, that global temperatures would have been unchanging in the absence of man-made greenhouse gas emissions, the correctness of IPCC’s assertion depends upon the period of time considered (Davis and Bohling, 2001). For example, temperatures have been cooling since 8,000 and 2,000 years ago; warming since 20,000 years ago, and also since 1850; and static (no net warming or cooling) between 700 BC and 150AD and since 1997 AD.
These warming and cooling periods are well known in climate science. The warming from 20,000 to 8,000 years ago brought the end to the last great ice age. The cooling period from 8,000 to 2,000 years ago is known as the Holocene cooling, since it occurred in the Holocene (human era). Climate scientists agree that these are real and due to natural causes. But these aren’t modern. The only “modern” warming trend it lists starts in 1850. It also states that there has been no net warming since 1997. We’ll come back to that one later.
The NIPCC report gives two temperature graphs as examples. One covering the past 2,000 years, and another covering the past 10,000 years. You can see the second one below:
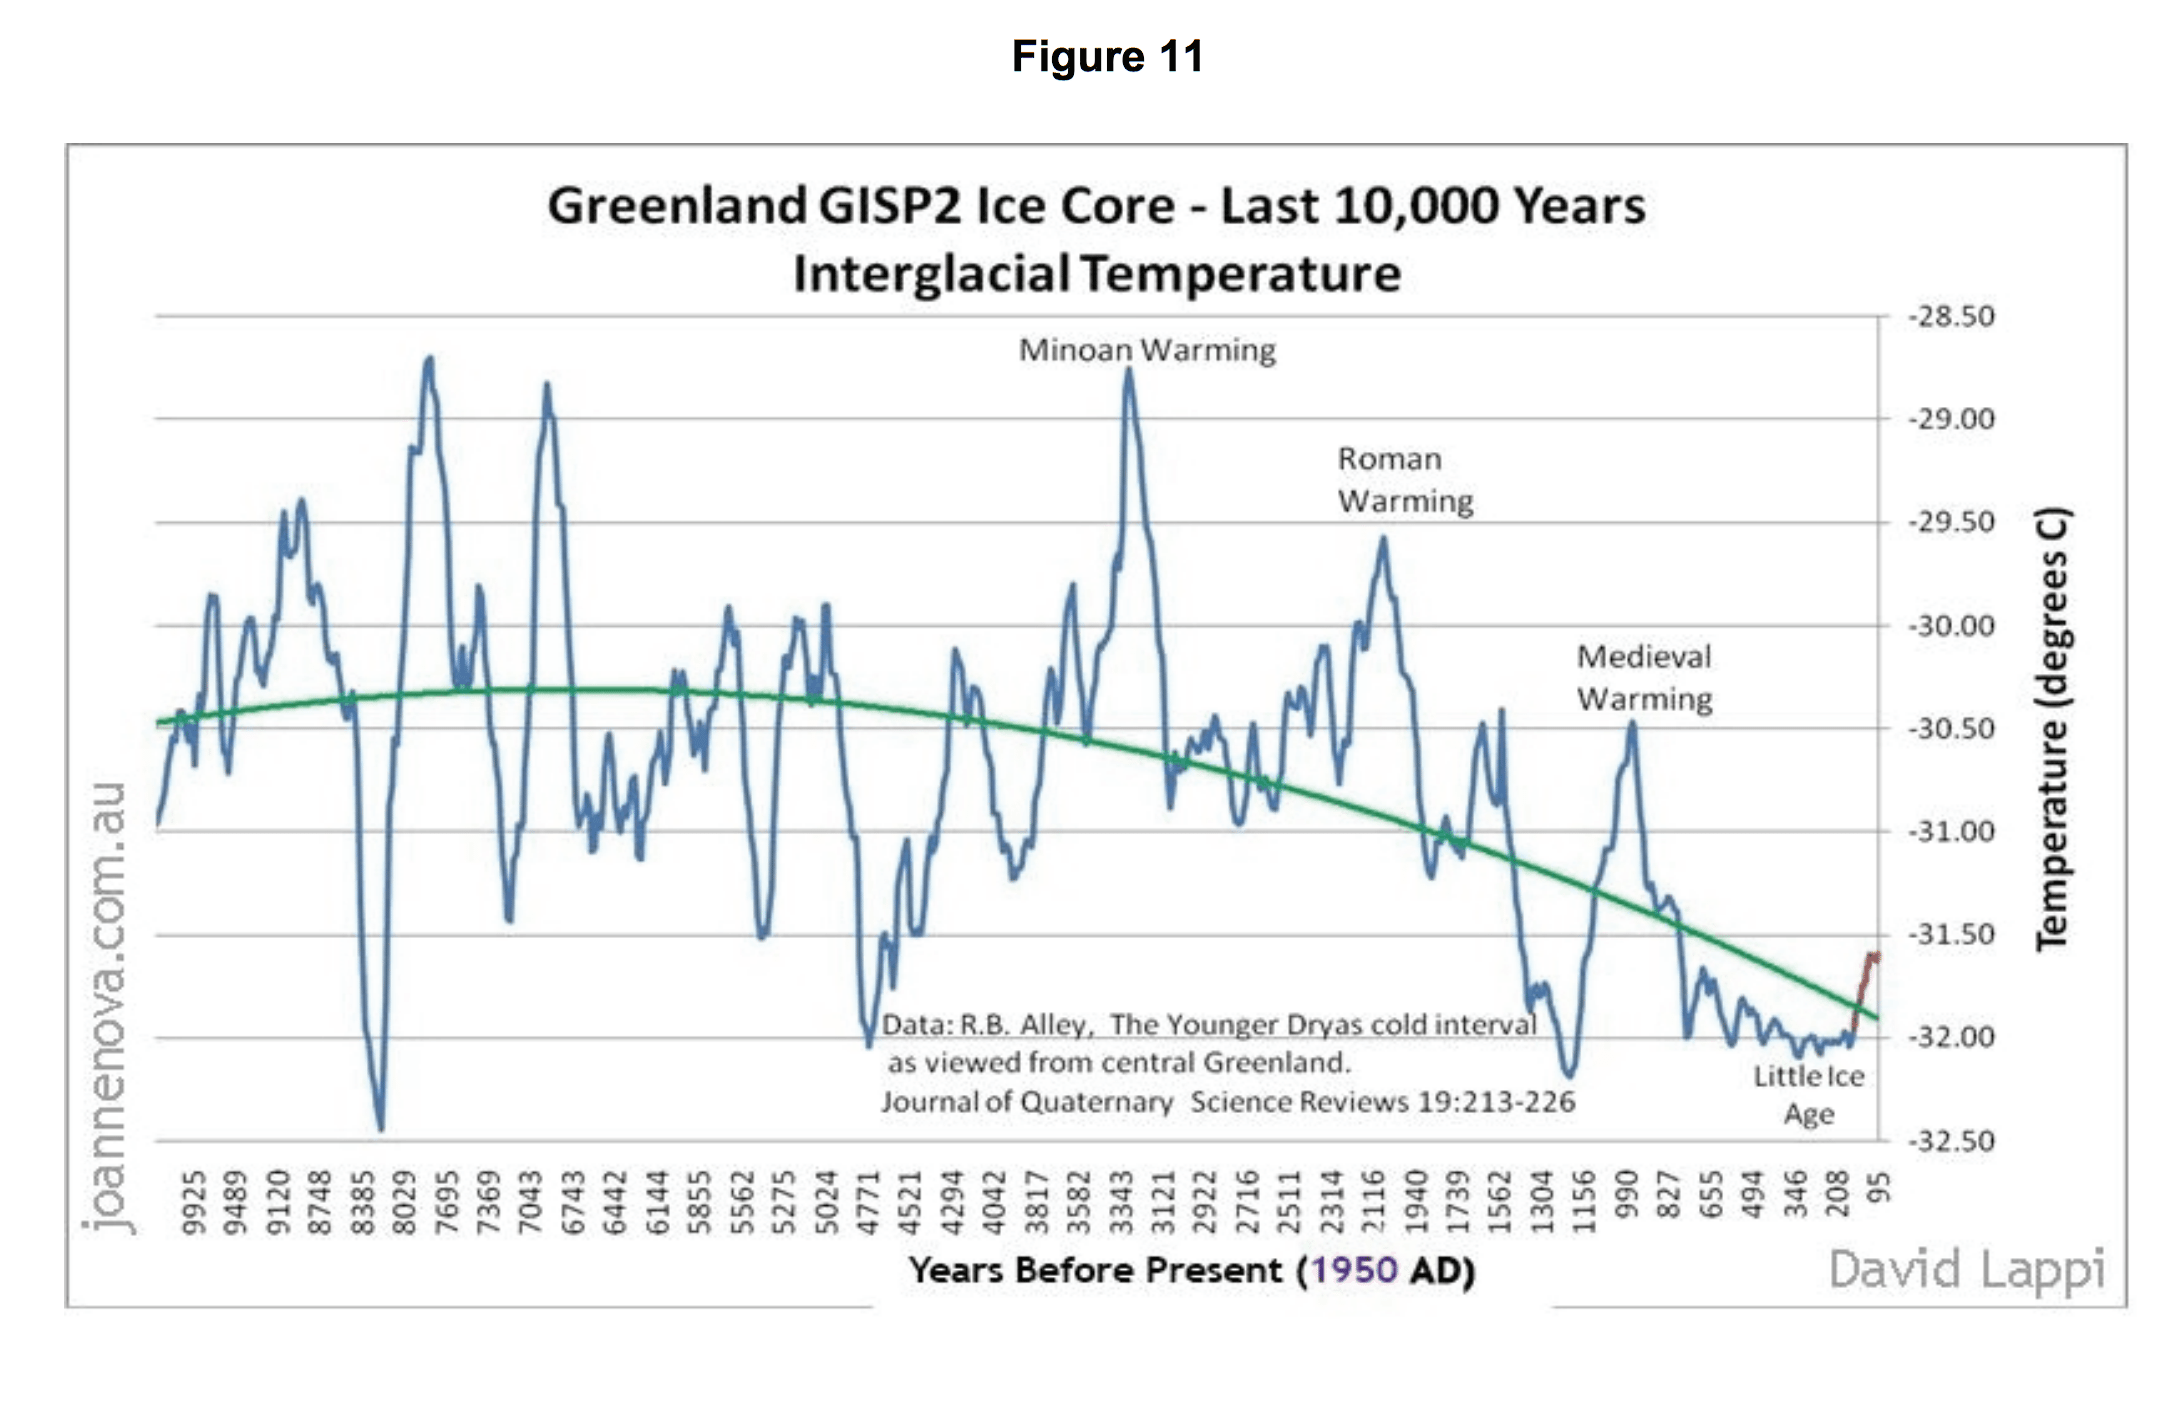 David Lappi
The blue line shows historical temperatures as calculated from ice core samples in Greenland. It shows several spikes in temperature where there have been warming periods. The green line is a trend line, and it shows that over the past several thousand years temperatures have gradually been falling. Maybe we’re due for a warming period after all. But there are a couple of problems with this graph. The first is that it only gives us temperatures in Greenland, not the world as a whole. The second is that this graph ends 95 years before 1950. It doesn’t show any data since 1855, so the “modern warming trend” isn’t even shown. Neither of the graphs in the report show temperatures since 1855. So let’s look at a graph of average global temperatures over the past 10,000 years, including the present era.
 Klaus Bitterman
This graph comes from A Reconstruction of Regional and Global Temperature for the Past 11,300 Years (Marcott et al.) a paper published in the journal Science in 2013.2 The graph combines 73 sets of temperature measurements from all over the world, rather than just one. The blue line is the best fit of the data, while the pale blue represents the uncertainty range. You’ll also notice the red spike. That’s our current warming trend (up until 1990). The paper is particularly interesting because it looks at the very claim the NIPCC report makes, namely that the Earth has gone through natural warming and cooling trends for thousands of years. What Marcott et al. find is that we now have “a global temperature higher than those during 90% of the entire Holocene.” We’ll get back to that in a bit.
Both the NIPCC report and the Marcott paper agree that there has been a cooling trend during the Holocene. But what could be the natural cause? The answer comes from astrophysics.
 Wikipedia
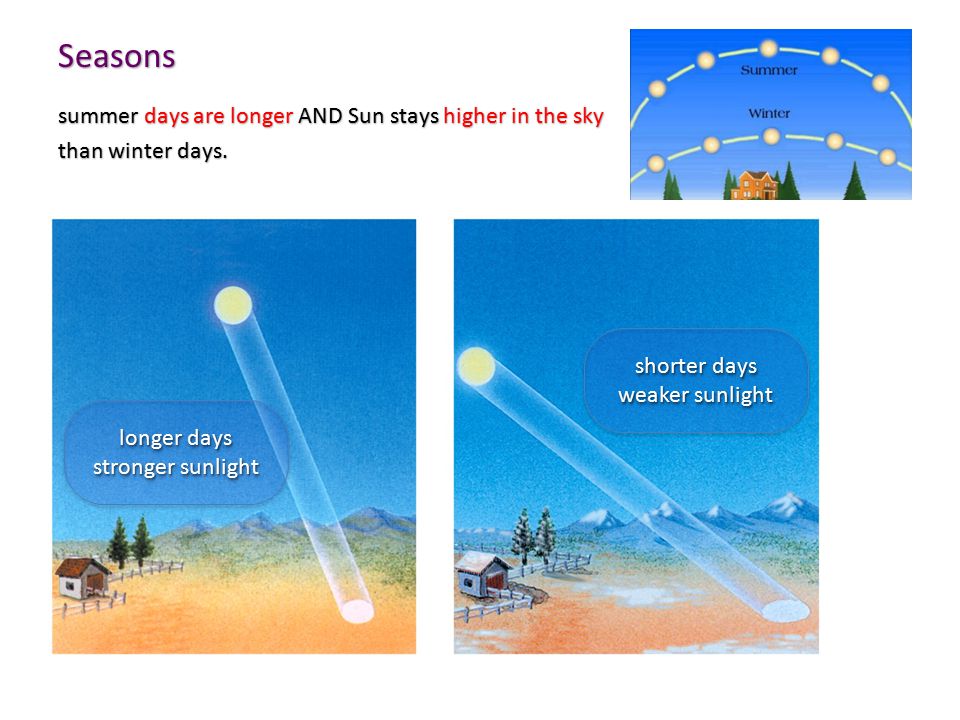
Our seasons are caused by the axial tilt of the Earth. Because the Earth’s axis is tilted about 23 degrees relative to its orbit, the Sun appears higher in the sky in Summer, and lower in the sky in Winter. When the Sun is higher in the sky, you get more solar energy per square foot, and when it’s lower you get less. This is known as insolation. Now when it is Summer in the Northern Hemisphere, it is Winter in the Southern Hemisphere, so that by itself doesn’t affect global temperatures. However, Earth’s axial tilt can change over time. When the tilt is less, seasons can be less extreme, and when the tilt is larger, seasons can be more extreme. The same is true with Earth’s orbit. Earth’s orbit isn’t a perfect circle, but a slight ellipse. Because of the gravitational tug from other planets, this gradually shifts over time. The Earth’s axis also precesses over time. These are known as Milankovitch cycles, and they mean that terrestrial insolation changes slightly over time.
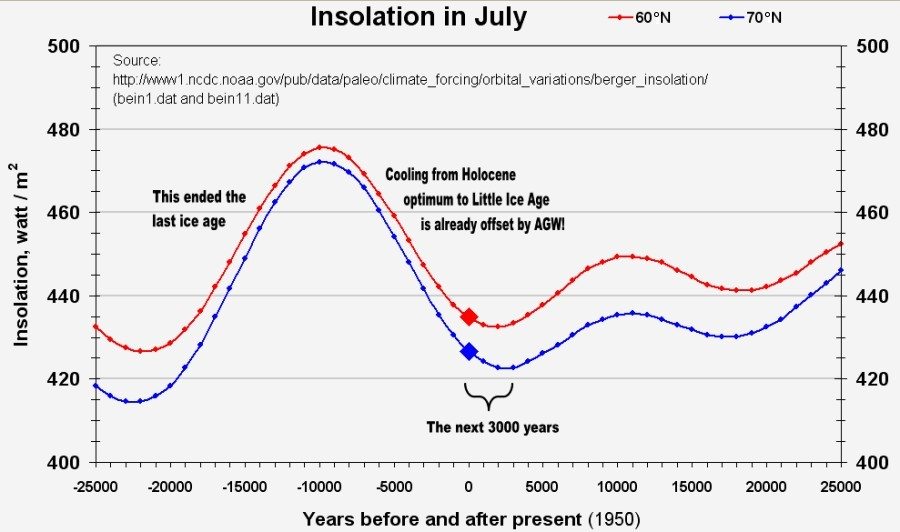 Wikipedia
The graph above shows how insolation varies over time in the Northern Hemisphere due to the Milankovitch cycles. That warming trend from 20,000 to 8,000 years ago? That corresponds to a gradual rise in insolation. The gradual decrease of insolation corresponds to the Holocene cooling. So it looks like the large periods of warming and cooling are driven by changes in insolation. I think we can agree with the first part of the NIPCC report, that historical variations in global temperatures occurred, and they had natural causes. It’s due in part to Earth’s orbital cycles, which climate scientists have been studying since the 1920s.
So what about the report’s second claim that modern temperature variations are also due to natural causes? This is where the NIPCC report gets really interesting. The report shows no graph of modern global temperatures. Nothing past the 1800s. I found a graph pretty easily, and it was published three years before the NIPCC report was published. The authors could have included a modern graph, but chose not to. They also make no mention of Milankovitch cycles or the variation of insolation. They don’t mention it because while it does explain earlier warming and cooling trends, it doesn’t explain the current one. If you look at the insolation graph above, you’ll see levels will still go down for the next few thousand years, so the natural trend would be global cooling. But global temperatures are actually rising. They are as high as the warmest period of the Holocene, when insolation levels were about 10% higher than they are today.
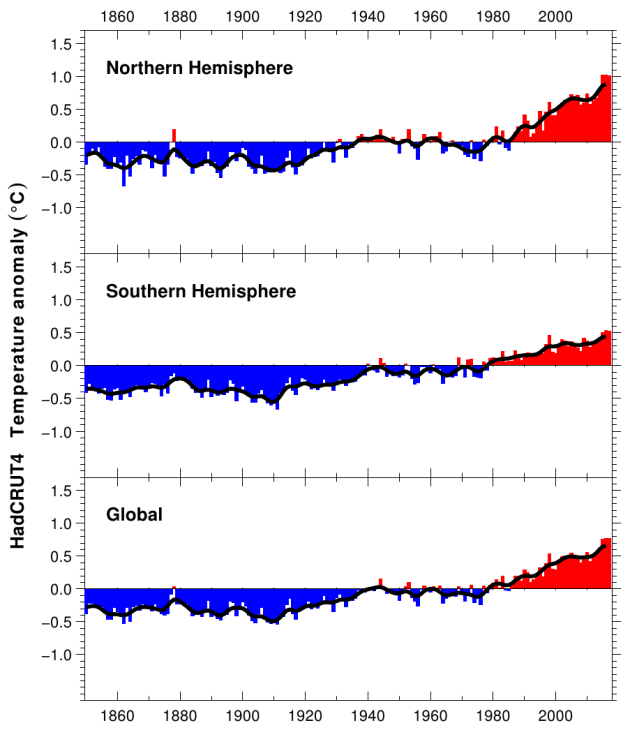 HadCRUT
Instead of looking at this, the NIPCC report notes two periods of global warming in the twentieth century to make its case. One from 1910-1940, and one from 1975 – 2000. The report doesn’t have any temperature graphs of these periods, so here’s one taken from global temperature measurements collected by research teams all over the world. If you look at the graph, sure enough between 1910 – 1940 there is a gradual rise in temperature. Then it cools off a bit for a few decades, but nowhere near what it was before 1910. Then from 1975 – 2000 things are getting warmer again. Here’s what the NIPCC report says about them on page 78:
The first period (1910–1940), having occurred prior to the build-up of greenhouse gases in the atmosphere, must represent natural variability. Measurements made during the late twentieth century warming are likely exaggerated by inadequate correction for the urban heat island effect (DeLaat and Maurellis, 2004; McKitrick and Michaels, 2004, 2007).
In other words, the first one happened before the big rise in CO2 levels, so it must be natural. The second occurs during rising CO2 levels, but it’s probably due to biased data. Since the authors think the first warming agrees with their hypothesis, they don’t question the accuracy of the data. Since the second warming doesn’t support their hypothesis, they question the data. This is known as confirmation bias.
Good scientists are aware of this bias. If the authors of this report were good scientists, they would look at it very closely. But the authors only cite three papers without any further discussion. The three papers (DeLaat and Maurellis, 2004;3 McKitrick and Michaels, 2004;4 McKitrick and Michaels, 20075) look at what is known as the urban heat effect. The basic idea is that many temperature readings are taken near heavily populated areas. Cities are big concrete jungles with lots of people, so they produce a lot of heat. What if the local heat from urban areas contaminate the measurements? Global temperature data would be off. The references listed discuss how this might be an issue, and we should probably look into it. They say temperatures might be exaggerated, but the amount of exaggeration is unclear and requires further study. Further study was done, and it was found that the urban heat effect isn’t significant.
 Brohan, et al
Here’s a graph from a 2006 study6 comparing temperatures in urban regions and rural regions across China. China has significantly urbanized in the past decades, so if there was an urban heat effect we should see an upward shift in urban data vs rural. Do you see any? The urban and rural data seem to match pretty well. The research concluded “Since the mid twentieth century the uncertainties in global and hemispheric mean temperatures are small, and the temperature increase greatly exceeds its uncertainty.”
In other words there might be some small urban effect, but nothing that can explain the current warming trend. The Heartland Institute chose to ignore this evidence. Instead, they chose to ignore it, and cited research noting the possibility of data bias to claim the latest warming trend can be ignored. This isn’t the first time they did this.
Remember the original claim that said there’s been no net warming since 1997? That’s a pretty important, because if it were true that would support their claim against global warming. CO2 levels have been rising significantly, and if temperatures have been flat for 20 years that could imply the two aren’t related. But the report never looks at it. The authors simply state it as a fact in the second paragraph, and never mention it again. This is also why they don’t include any modern temperature graphs. If you look at the temperature graph below, it seems pretty clear that temperatures been rising steadily since 1975, with no signs of stopping.
 NOAA
NOAASo how can the authors claim that temperatures have been flat since 1997? You see that spike on the graph in the late 1990s? The one that marks an unusually large jump from the year before? That’s 1997. It was an unusually warm year, even for modern times. If you take that year as a starting point, you can imagine drawing a horizontal line that’s above all the temperature readings until about 2010. After that the lines are higher. But except for the past few years, temperatures have been “flat” since 1997. It only works if you pick 1997. Pick any other year from about 20 years ago and the trend is clearly rising. Their claim isn’t honest, which is why they don’t show you the data.
If we want to approach this issue rationally and scientifically, we have to look at all the evidence. In this series we’ve seen how the authors used framing and emotional wording, how they intentionally conflated opinions about global warming with data on global warming, and how they wrote the book to make it difficult to verify their evidence. When we finally dig into the actual details, we find they don’t present research in an honest way. This leads us to a clear and evidence based conclusion: the NIPCC report Why Scientists Disagree About Global Warming is a lie.
The Heartland Institute is promoting that lie to your children, and they can’t be trusted to present climate research honestly. If you’d like to explore climate research further, I suggest RealClimate, a website about climate research written by actual climate scientists.
Idso, Craig D., Robert M. Carter, and S. Fred Singer. “Why scientists disagree about global warming.” The Heartland Institute. (2015). ↩︎
Marcott, Shaun A., et al. “A reconstruction of regional and global temperature for the past 11,300 years.” Science 339.6124 (2013): 1198-1201. ↩︎
De Laat, A. T. J., and A. N. Maurellis. “Industrial CO2 emissions as a proxy for anthropogenic influence on lower tropospheric temperature trends.” Geophysical Research Letters 31.5 (2004). ↩︎
McKitrick, Ross, and Patrick J. Michaels. “A test of corrections for extraneous signals in gridded surface temperature data.” Climate Research 26.2 (2004): 159-173. ↩︎
McKitrick, Ross R., and Patrick J. Michaels. “Quantifying the influence of anthropogenic surface processes and inhomogeneities on gridded global climate data.” Journal of Geophysical Research: Atmospheres 112.D24 (2007). ↩︎
Brohan, Phillip, et al. “Uncertainty estimates in regional and global observed temperature changes: A new data set from 1850.” Journal of Geophysical Research: Atmospheres 111.D12 (2006). ↩︎